



Peptide Agonist: What Receptor Activation Really Shows

TL;DR · The short version
A peptide agonist produces receptor activity in a tested system. Binding alone doesn’t establish it. Look for the receptor, response, concentration-response curve and reference compound, then keep that assay context with the finding.
A clear curve and a low nanomolar number look promising. Before calling the peptide a strong agonist, check the column heading. The number may describe binding rather than activation.
We’ll separate those questions so the experiment stays interpretable without requiring a full pharmacology course.
What makes a peptide an agonist?
Quick takeaway: An agonist produces receptor activity. An antagonist blocks an agonist’s activity; neither label follows from binding alone.
A peptide is an amino-acid chain. “Agonist” describes receptor activity, rather than a separate chemical class. An agonist stimulates a response; a neutral antagonist blocks it without activation. An inverse agonist reduces unstimulated activity. The NCATS Assay Guidance Manual distinguishes these actions.
“The peptide activated receptor X in this cellular assay” identifies the action and setting. Retaining that information makes the sentence more useful than the label “agonist” alone.
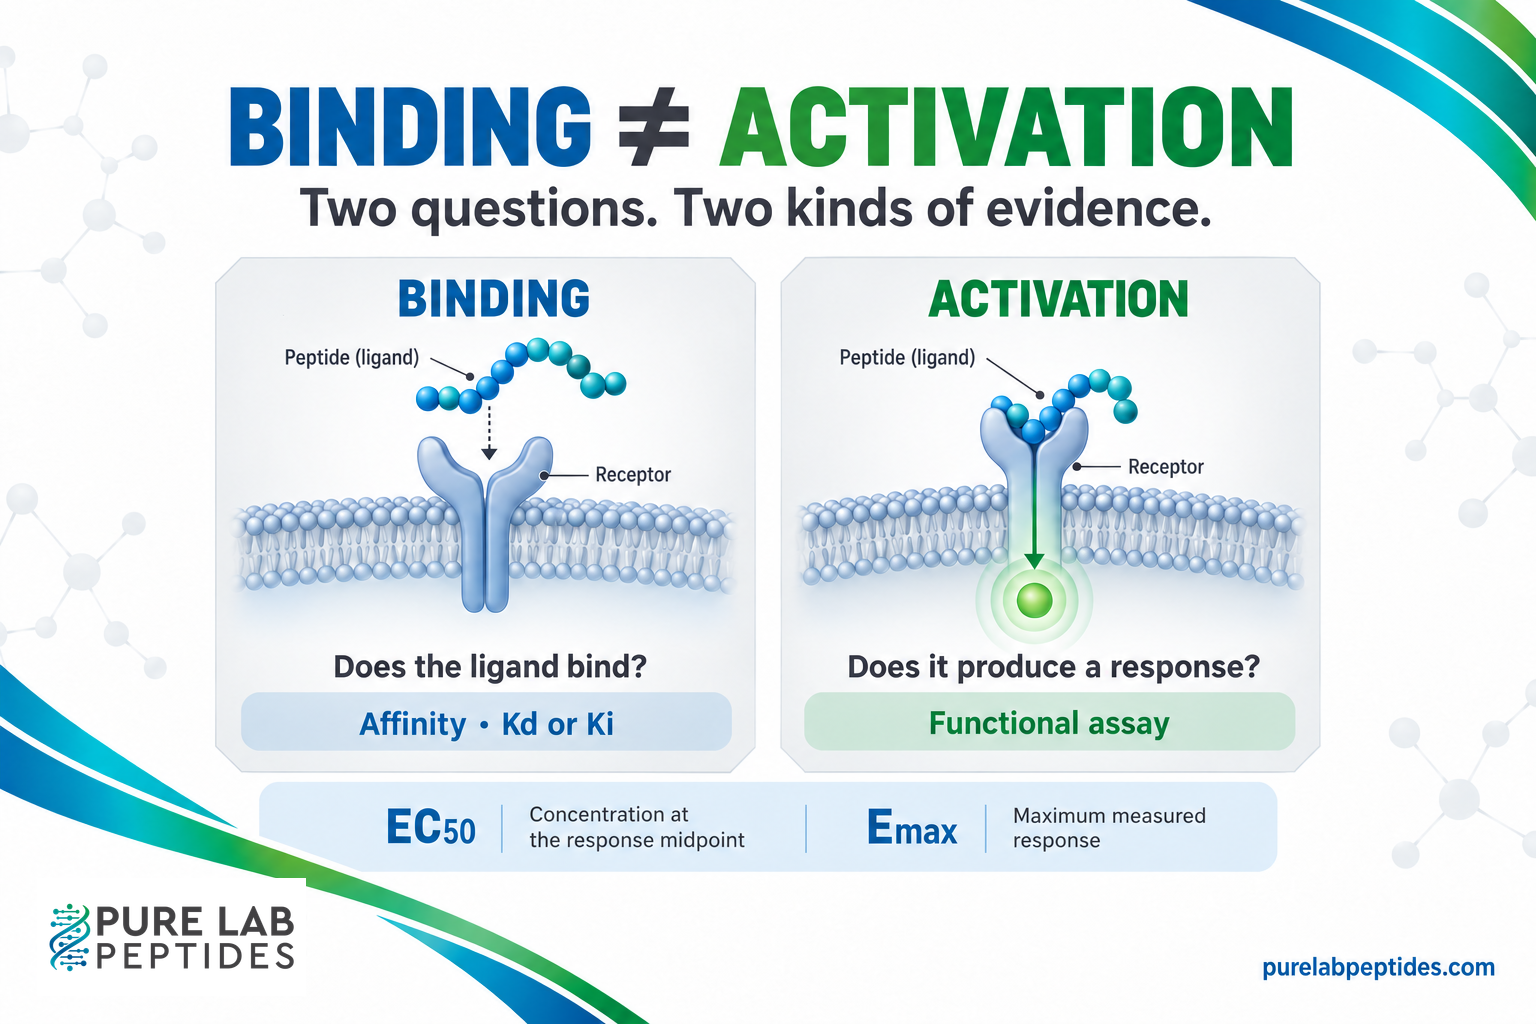
Binding, potency and efficacy are different results
Quick takeaway: Read the column heading before comparing the numbers. Kd, EC50 and maximum response aren’t interchangeable.
| Reported result | Question it addresses | What to check next |
|---|---|---|
| Binding affinity, such as Kd | How does the ligand bind under these conditions? | Receptor preparation, binding method and units |
| Potency, often EC50 | What concentration gives half of the fitted response range? | Baseline, upper plateau and the measured endpoint |
| Efficacy, often an Emax comparison | How large is the maximum response in this system? | Reference agonist and the normalization method |
| Partial agonism | Does the maximum fall below the reference in this assay? | Whether both compounds were tested comparably |
GraphPad’s EC50 guide defines EC50 halfway between the fitted bottom and top. That needn’t be a response value of 50, or half the response of another compound.
Here’s a hypothetical example. A curve starts at 20 response units and reaches 80. Its midpoint is 50 units. EC50 is the concentration at that midpoint. If a second curve starts at zero and reaches 200 units, its midpoint is 100. Comparing the concentrations requires knowing those response ranges, too. These numbers are an illustration, not experimental results.
The fitted curve model determines how the curve was fitted. Standard sigmoidal and variable-slope models make different choices; inspect the tested concentrations and plateaus too. A tidy fit can’t create measurements that weren’t made.
Ask what the assay actually measured
Quick takeaway: A response needs a named endpoint and controls that connect it to the receptor.
For a G protein-coupled receptor (GPCR), readouts include cAMP, calcium signaling and beta-arrestin recruitment. The NCATS manual describes receptor-negative cells and counter-assays for investigating whether a signal comes from the intended target. That’s the connection to check, rather than just the chart’s appearance.
Note the change, its measurement and the control results before accepting the interpretation. If one is missing, record the gap instead of filling it with an assumption.
A GLP-1 receptor study illustrates why more than one line of evidence can help. Its researchers combined structural work, simulations, mutagenesis and pharmacological assays to examine several peptide agonists. The study connects receptor interactions with signaling behavior; a binding picture by itself wouldn’t provide the whole comparison. Our GLP-1 receptor literature guide covers that family separately.
Keep “full,” “partial” and “biased” tied to the experiment
Quick takeaway: These labels need a reference and an assay context. They aren’t permanent rankings of peptide quality.
For “partial agonist,” locate the reference response, endpoint and cell system. Keep them beside the result. The adjective isn’t a permanent ranking of material quality.
Biased agonism adds another comparison: a ligand favors one signaling pathway relative to another, compared with a reference ligand. The IUPHAR community guidelines explain why assay conditions and system differences can affect that interpretation. One strong endpoint isn’t enough to establish pathway bias.
A specific note such as “calcium response measured; another signaling endpoint wasn’t examined” is more useful than a broad pathway label. It tells the next reader what evidence exists.
A short reading record you can actually use
Quick takeaway: Record the experiment’s identity as carefully as the material’s identity.
Keep this five-line record beside a paper: receptor and species; cellular model; endpoint and timing; concentration units and fitted metric; reference compound and controls. Add a separate line for anything the study didn’t test.
Check the abstract’s potency claim against the methods and captions. If a comparable concentration-response result is missing, leave the comparison incomplete. The how to read peptide research literature provides the broader reading workflow.
Activity and material records have separate jobs. A COA reports its stated analytical tests, not automatically receptor agonism. The purity versus identity guide explains that distinction.
This article concerns laboratory evidence. It doesn’t provide dosing advice or turn a receptor experiment into a claim about a person’s response. For that final distinction, read scientific mechanisms versus consumer claims.