



Receptor Selectivity: Comparing Peptide Assay Evidence

TL;DR · The short version
Receptor selectivity describes preference among tested receptors. Compare binding with binding, or the same functional endpoint under comparable conditions. The result belongs to that panel and assay; it doesn’t prove exclusive action at one receptor everywhere.
A binding paper and signaling paper may give different impressions of the same peptide. Before treating that as a contradiction, check whether their measurements answer the same question.
The ratio is quick to quote. Its meaning comes from the experiment behind it.
Start with the receptors and the metric
Quick takeaway: “Selective” needs a named comparison. Ask: selective for which receptor, against which others, measured how?
Binding assays examine affinity; functional assays measure a response. The NCATS Assay Guidance Manual treats these as different measurements. Start by identifying which one the paper reports.
Keep Ki with Ki, Kd with Kd and EC50 with EC50 for a common endpoint. Dividing binding at one receptor by signaling at another doesn’t produce a defensible selectivity ratio.
Record the targets and species actually tested. One related-receptor comparison isn’t a broad panel. “A versus B in these cells” is a more useful description than highly specific.
What a selectivity ratio does and doesn’t tell you
Quick takeaway: A ratio describes the measured difference. It doesn’t explain every cause of that difference.
Here’s a deliberately simple, hypothetical comparison. Both results use a calcium-response assay in the same cell background, with each receptor tested in its own model.
| Item to compare | Receptor A model | Receptor B model |
|---|---|---|
| Endpoint | Calcium response | Calcium response |
| Fitted EC50 | 5 nM | 100 nM |
| Maximum response | Record against this model’s reference | Record against this model’s reference |
| Model details | Record receptor expression and controls | Record receptor expression and controls |
| Interpretation | 100 ÷ 5 = 20-fold lower EC50 at A in this assay comparison | |
The restrained conclusion is useful: the peptide required a lower concentration for its midpoint response in model A. Calling it “20 times better” would add a judgment the table doesn’t support. Neither would the two models, by themselves, establish exclusive activity at A.
EC50 is the midpoint of the fitted response range. So keep the baseline and maximum response with the ratio. If one curve barely rises above the assay background, inspect it before treating its fitted number as a stable comparison.
Retain uncertainty and replication information from the paper. If either is absent, mark it absent; a precise-looking ratio doesn’t replace the evidence.
A real peptide example: binding and signaling separated
Quick takeaway: The same peptide can show different degrees of preference depending on the measurement.
Rupniak and colleagues tested neurokinin A and related peptides at human recombinant NK2 and NK1 receptors in CHO cells. Their 2018 study reports a 20-fold NK1/NK2 Ki ratio for neurokinin A, while its calcium EC50 ratio was 1 and its cAMP EC50 ratio was 2.8.
These assays showed different binding and functional preferences. They don’t establish a commercial vial’s performance or forecast human effects.
When you cite a paper like this, keep the endpoint in the sentence with the number. “A 20-fold binding-affinity ratio” gives the reader something they can check. “20-fold selectivity” makes them search for the missing measurement.
Receptor selectivity and pathway bias aren’t the same comparison
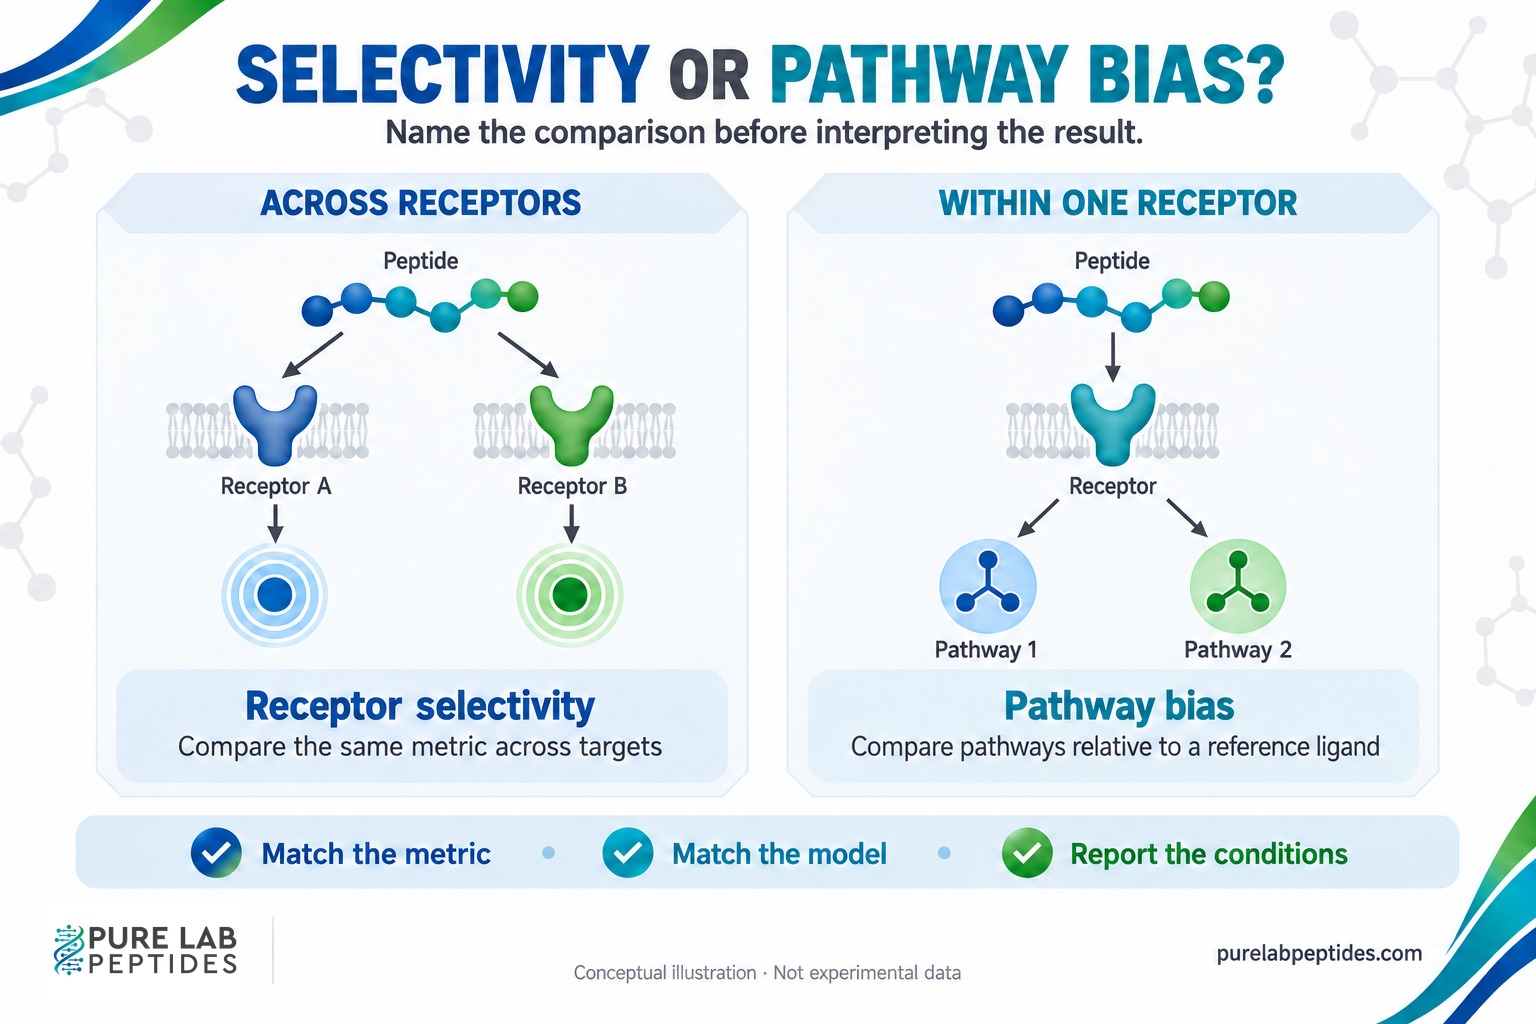
Quick takeaway: Selectivity compares receptors. Pathway bias compares signaling routes relative to a reference ligand.
Receptor subtype selectivity asks how a ligand behaves across different targets. Biased agonism asks whether it favors one signaling pathway over another at a receptor, compared with a reference ligand. The IUPHAR community guidelines on G protein-coupled receptor (GPCR) ligand bias emphasize that this is a relative comparison and that assay sensitivity and system differences can create misleading impressions.
Check what the authors mean by functionally selective: receptor subtypes, signaling pathways or both. Recording the actual comparison avoids carrying an ambiguous label into another summary.
Where secretagogue research fits
Quick takeaway: A shared hormone-release outcome doesn’t establish a shared receptor mechanism.
The IUPHAR ghrelin record identifies activity at the ghrelin receptor, GHSR. Separately, the NCBI GHRHR record describes the growth hormone-releasing hormone receptor. These are distinct receptor targets, even though both are relevant to growth hormone biology.
So a hormone-release measurement and a receptor-panel experiment belong in different parts of a review. If you’re reading about a specific secretagogue, use its receptor evidence for that claim rather than filling the gap with a shared downstream outcome. Our GHRP-2 research overview provides compound-specific context.
Write the comparison so someone else can follow it
Quick takeaway: Keep the target panel, assay conditions and limits beside the result.
Name receptors, model, endpoint, comparable metric and limitation, adding reference and timing when reported. A colleague should be able to reconstruct the comparison from that record.
If the comparison remains unclear, add specificity before confidence. The research-literature reading guide expands the worksheet, and the in vitro versus in vivo guide explains the evidence needed beyond an engineered cell model.