



HPLC vs LC-MS vs NMR: What Each Test Tells You

TL;DR · The short version
HPLC vs LC-MS vs NMR is a comparison of different kinds of evidence. HPLC separates components before detection; LC-MS adds mass-to-charge information; NMR examines chemical environments. Choose the measurement that answers your question about the sample.
It is tempting to treat a longer test list as a better answer. But “tested by HPLC” and “tested by LC-MS” do not tell you which property was measured, how it was measured or what the result means.
Start with the question: are you checking separation, identity, structure or quantity? Then read the method and reported result together.
How the techniques fit together
TL;DR: HPLC and LC-MS overlap: liquid chromatography can provide the separation before mass spectrometry.
HPLC stands for high-performance liquid chromatography. Components travel through a column and reach a detector at different times under the chosen conditions.
LC-MS couples liquid chromatography to mass spectrometry. The detector provides information about ions and their mass-to-charge ratios. NMR (nuclear magnetic resonance) uses signals from nuclei to examine chemical environments. The CNRS LC-MS platform and EMBL-EBI’s NMR/MS comparison explain these complementary roles.
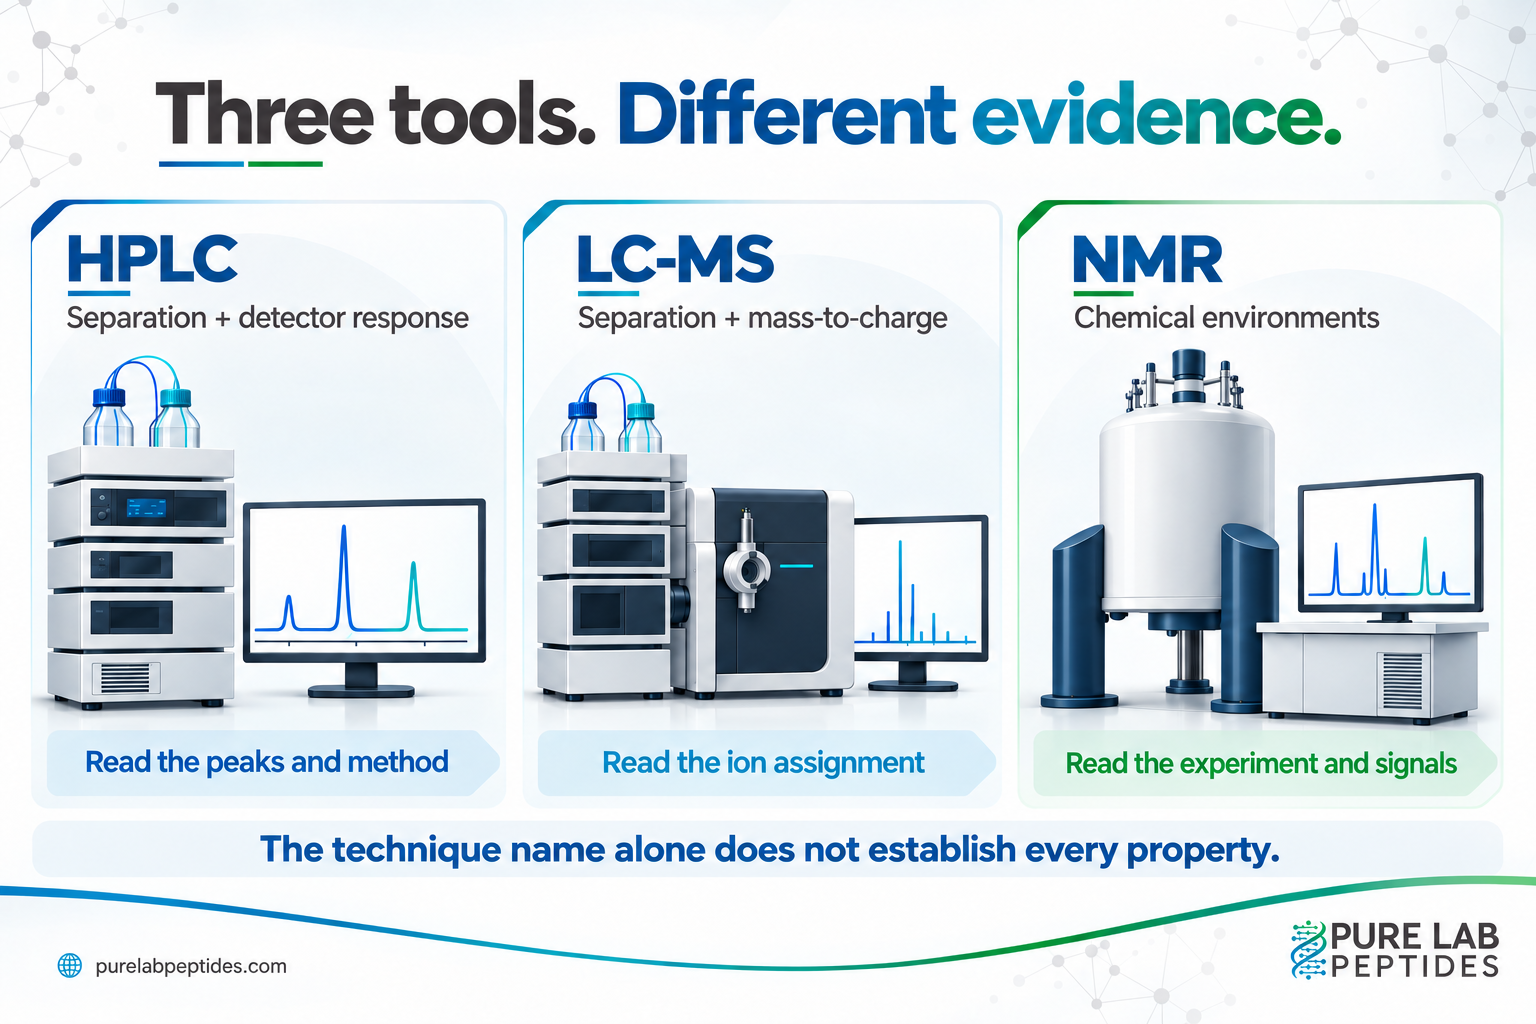
HPLC: examine the separation and reported percentage
TL;DR: A chromatogram must be interpreted with its detector, integration and calculation method.
A well-documented HPLC result can show the separation observed under the method and report the responses assigned to particular peaks. A stated area percentage needs its denominator: which peaks contributed to the total?
Quantity is a separate question. Waters’ HPLC primer explains quantitation using detector response and reference standards. The largest peak alone does not establish how much peptide was in the original vial.
For a worked example, see how to read an HPLC chromatogram.
LC-MS: inspect the ion assignment
TL;DR: Mass-spectrometric evidence can support identity and impurity work, within the method’s demonstrated capabilities.
In a 2015 LC-HRMS study, researchers used salmon calcitonin, bivalirudin and exenatide as model systems. Their method characterized peptide-related impurities, including some that coeluted, and evaluated quantitative performance.
The useful lesson is the added evidence from the mass-spectrometric data. It is not a guarantee that every LC-MS run detects every impurity or proves a complete sequence.
When reading a result, look for what the laboratory assigned: an intact-mass match, a particular ion or fragment evidence. Also check whether the report supports a quantitative conclusion or only an identity comparison.
NMR: inspect the experiment and usable signals
TL;DR: NMR can contribute structural or quantitative evidence, but those uses require an appropriate experiment.
NMR is useful when the question concerns chemical environments and structure. Quantitative NMR, or qNMR, requires a method designed for measurement rather than simply displaying a spectrum.
In a 2014 study of valine and peptide T5, researchers addressed crowded peptide signals by removing unwanted exchangeable signals and using a suitable internal standard. Those choices were part of what made the measurement possible.
The EMBL-EBI comparison discusses differences in sensitivity and preparation between NMR and MS in metabolomics. Treat that as context, not as a fixed sample requirement for every peptide assay. The laboratory’s validated method determines what material and measurements it needs.
Match the evidence to the question
TL;DR: Compare results only after checking the property, units and reporting basis.
Use these questions when you request or review a report:
- Separation: What does the chromatogram show under the stated method?
- Identity: What reference, mass, fragment or structural evidence supports the assignment?
- Quantity: What was measured, against which reference and in which units?
- Comparability: Do the two results describe the same property on the same basis?
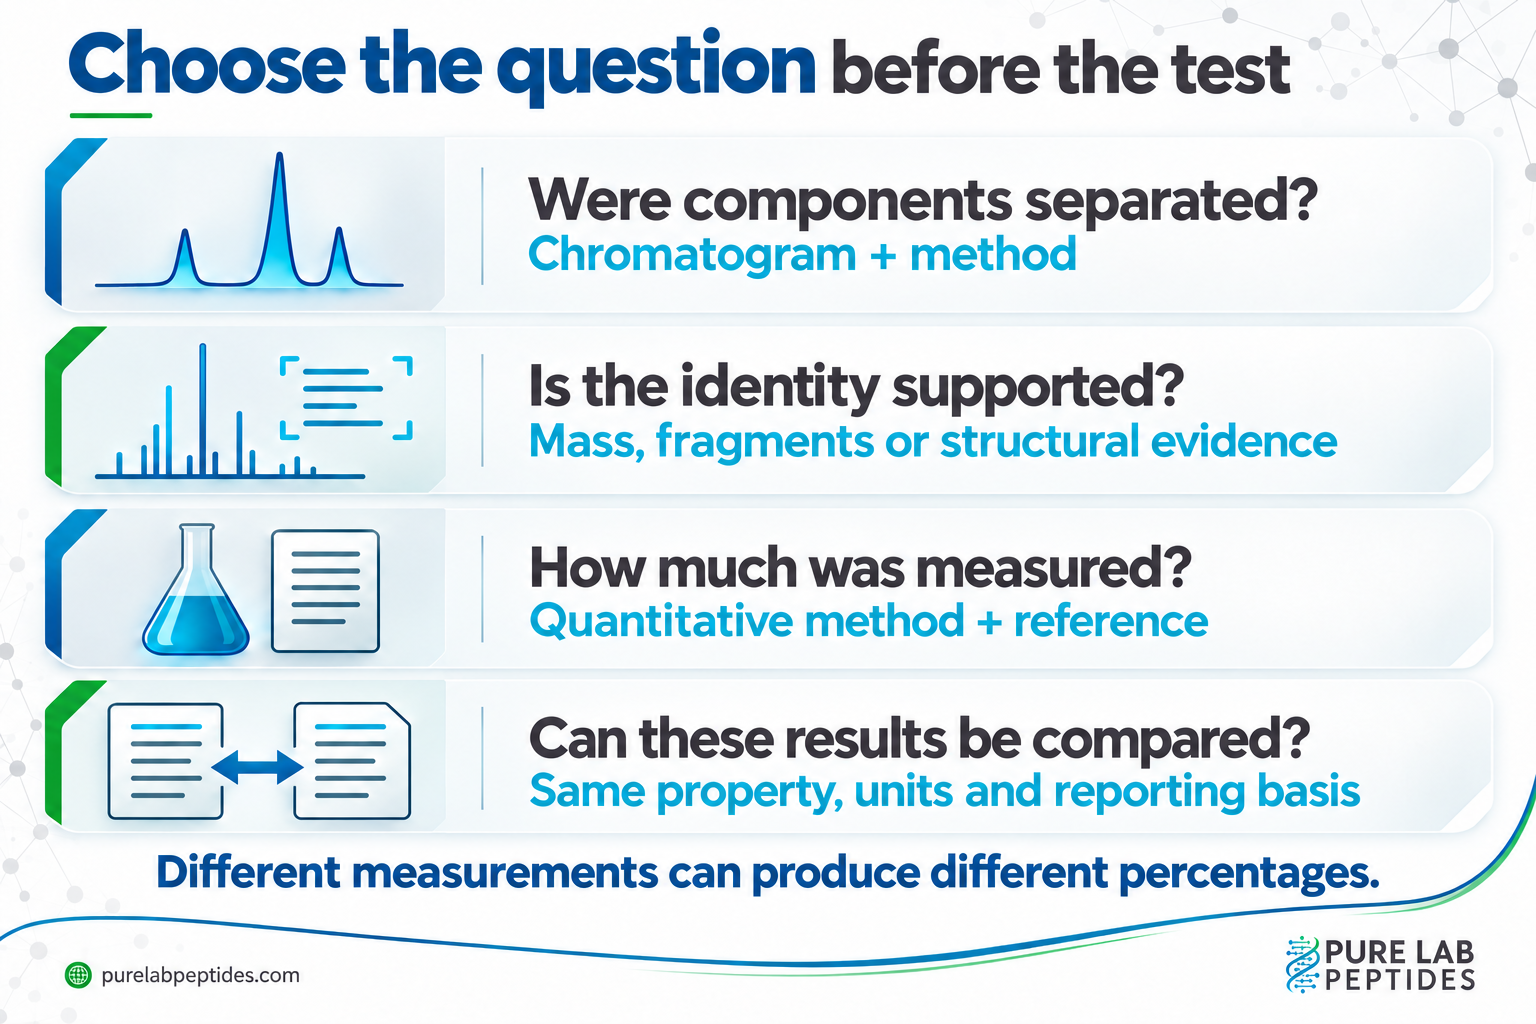
Why two percentages may differ
TL;DR: Different percentages may describe different quantities; their labels and denominators decide whether they can be compared.
Consider a hypothetical report with an HPLC peak-area result and a separate content result expressed in milligrams. One describes a share of included detector response; the other describes a measured amount. They cannot be substituted for each other.
Even when both results use percentages, read the basis. Ask the laboratory what the numerator and denominator represent before calling the results inconsistent.
A useful conclusion names the evidence and its limit. “The assigned mass was consistent with the expected material” is more precise than letting the word “tested” stand in for identity, purity, quantity and every other property at once.